
September 30, 2021 – To build an understanding of the current market trends that are impacting the Memphis Metro area, the Chamber has been releasing monthly updates to our economic recovery.
To best gauge and position insights related to market activity, we are looking at the region through two lenses. The first is through the lens of traditional monthly indicators. These measures include the lower frequency jobs and unemployment figures and are often seen as lagging indicators of labor market activity. The second lens is through higher frequency weekly indicators. These measures include weekly unemployment insurance claims and job postings. Often, the higher frequency indicators are seen as leading indicators and can signal worsening or better employment outcomes for the region against the monthly reports.
The Greater Memphis Chamber develops insights that help stakeholders ask the right questions to issues impacting our region’s economic competitiveness. To understand the impact of COVID in the current economic environment, the team analyzes data using a combination of sources such as the Bureau of Labor and Statistics as well as cutting-edge tools such as Burning Glass Labor Insights and EMSI, the Chamber aims to provide stakeholders with information that can help drive prosperity for all in the region.
INDICATORS TO WATCH
KEY FINDINGS FROM THIS REPORT:
Monthly Indicators, [lower frequency, lagging indicators]
- The Memphis region is 1.1% below its March 2020 level and ranks 2nd on job recovery against a competitive set of metropolitan areas.
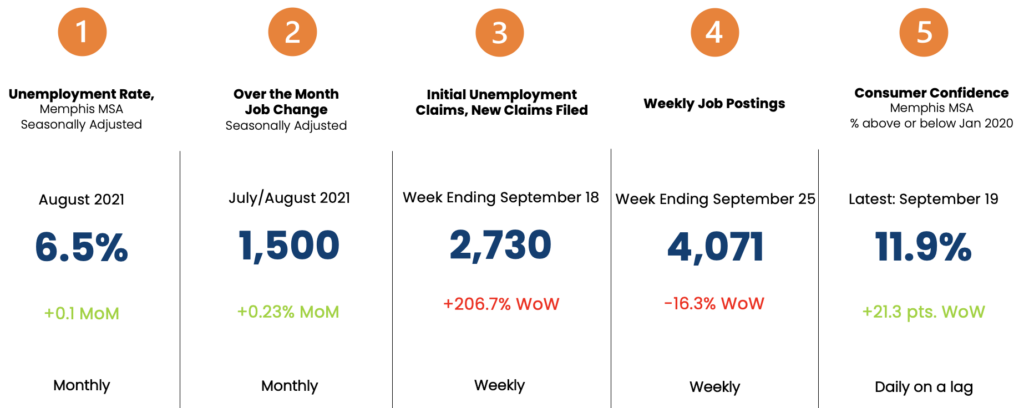
- August 2021, the seasonally adjusted unemployment rate in the Greater Memphis MSA was 6.5%, showing a consistent level from the past two months. The next release for (September 2021) metropolitan estimates will be November 1, 2021.
- Seasonally adjusted non-farm payrolls (jobs) in the Memphis metropolitan area increased by 1,500 (0.23%) from July to August 2021.
- The industry of Professional/Business Services is 14.4% above its March 2020 level. Construction, Transportation, and Financial Activities all show some level of growth from their respective March 2020 level.
Weekly Indicators, [higher frequency, leading indicators]
- After falling through July and August 2021, initial claims have increased over 200% from week ending September 4th to week ending September 18th.
- While job postings saw an increase by over 20% from the Q1 2021 to the Q2 2021, postings have seen a small contraction while still maintaining averages well above those of the past three years.
- While the Greater Memphis market holds moderately high unemployment, many employers continue to hire. Broad based occupational groups are in demand in key areas including Warehousing, Truck Driving, Nursing, and Retail positions.
- Consumer Spending, a proxy for consumer optimism, is the amount of money spent by households in an economy for durable and nondurable goods and services. Sharp declines are shown through the month of February and might be influenced by the large winter storm in February 2021. As of September 19th, spending was 11.9% above January 2020.

Questions? We would love to hear from you! Click here to send a question or request media access.
